

Quickstart for Code Insights
Get started and create your first code insight in 5 minutes or less.
Introduction
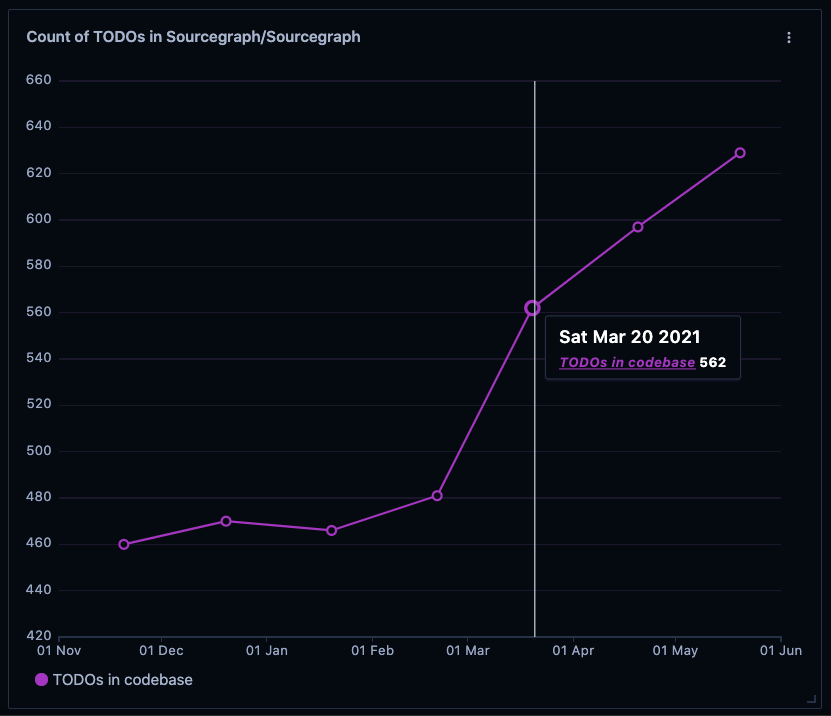
In this guide, you'll create a Sourcegraph code insight that tracks the number of TODOs that appear in parts of your codebase.
For more information about Code Insights see the Code Insights documentation.
Requirements
- You are a Sourcegraph enterprise customer. (Want code insights but aren't enterprise? Let us know.)
- Your Sourcegraph instance has at least 1 repository. (See "Quickstart" on how to setup a Sourcegraph instance.)
- Your Sourcegraph instance is deployed via Docker Compose or Kubernetes.
Create a code insight
1. Visit your example.sourcegraph.com/insights page and select "+ Create insight"
2. On the insight type selection page, select "Track changes"
This creates a code insight tracking an arbitrary input that you could run a Sourcegraph search for.
Your other options are to:
- create a "Detect and track" insight to automatically generate your data series according to capture group matching.
- create a language-based insight to show you language breakdown in your repositories.
3. Select the repositories you want to search
If you want an insight running over a specific amount of repositories, enter the repositories in the repository URL format, like github.com/sourcegraph/sourcegraph.
Separate multiple repositories with a comma. The form field will validate that you've entered the repository correctly.
You can also define the repositories you want your insight to run over using a Sourcegraph search query, for example repo:.* to run over all repositories. Read the reference to learn more. If you want to exclude specific repositories, you can do so after creating the insight by using filters (step 8).
4. Define a data series to track the incidence of TODO
A data series becomes a line on your graph.
You can Name this data series something like TODOs count.
To track the incidence of TODOs, you can set your Search query to be simply TODO.
You can also select the color of your data series.
5. Add a title to the insight
Enter a descriptive Title for the chart, like Count of TODOs in [repository name].
6. Set the distance between data points
Code insights give you twelve datapoints for each data series on insight creation. Setting it to one month means you'll see the results over the last year.
7. Click "create code insight" and view your insight.
You'll be taken to the example.sourcegraph.com/insights page and can view your insight.
8. Filter your insight to explore it further
Click the filter button in the top right of an insight card to open the filters panel. This allows you to filter the insight down to a subset of repositories through inclusion or exclusion using regular expressions. For more details, see How to filter an insight.